In this project we will be working with the following model of a spread of an infectious disease.
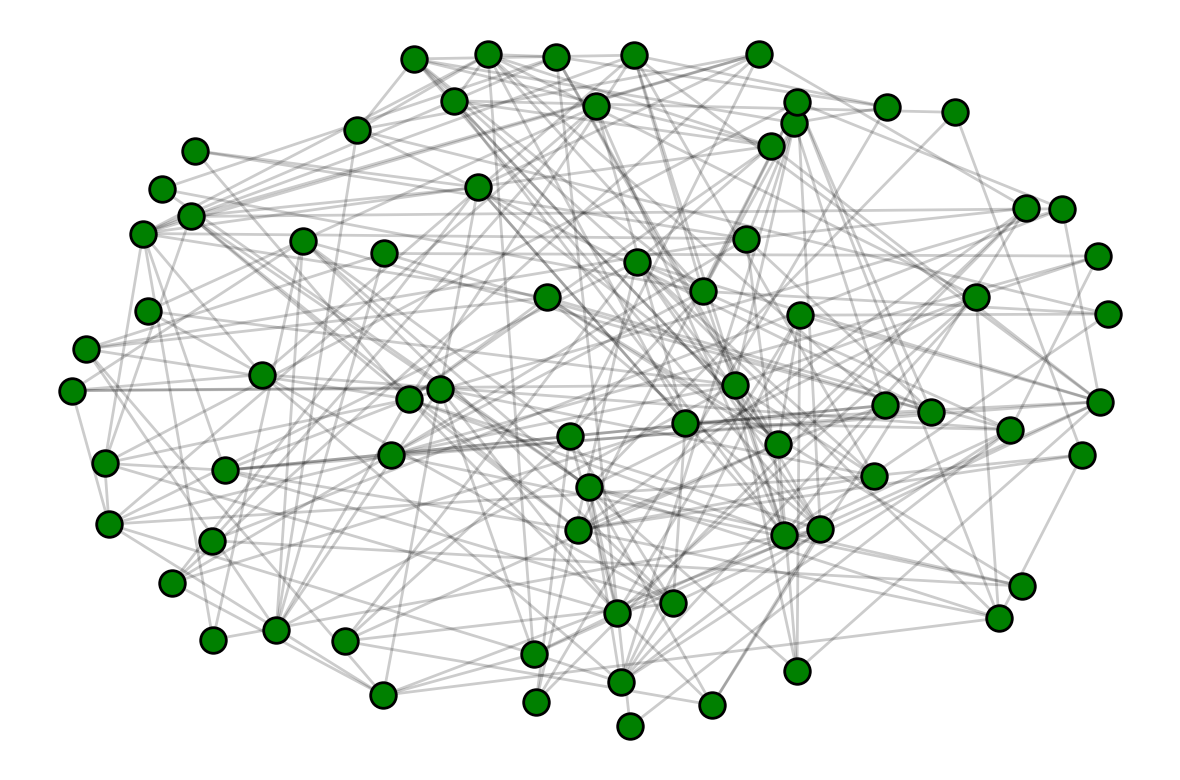
First, we create a graph representing interations between people. Each node in this graph is a person. If two nodes are connected by an edge, then the people they represent are in contact and can infect each other.
Each node in the graph is in one the following states:
| Value | Meaning | |
|---|---|---|
0 | The node is healthy, but it can become infected. | |
1 | The node is infected and can infect its healthy neighbors. | |
2 | The node was infected, but it recoved from the disease and can’t get infected anymore. |
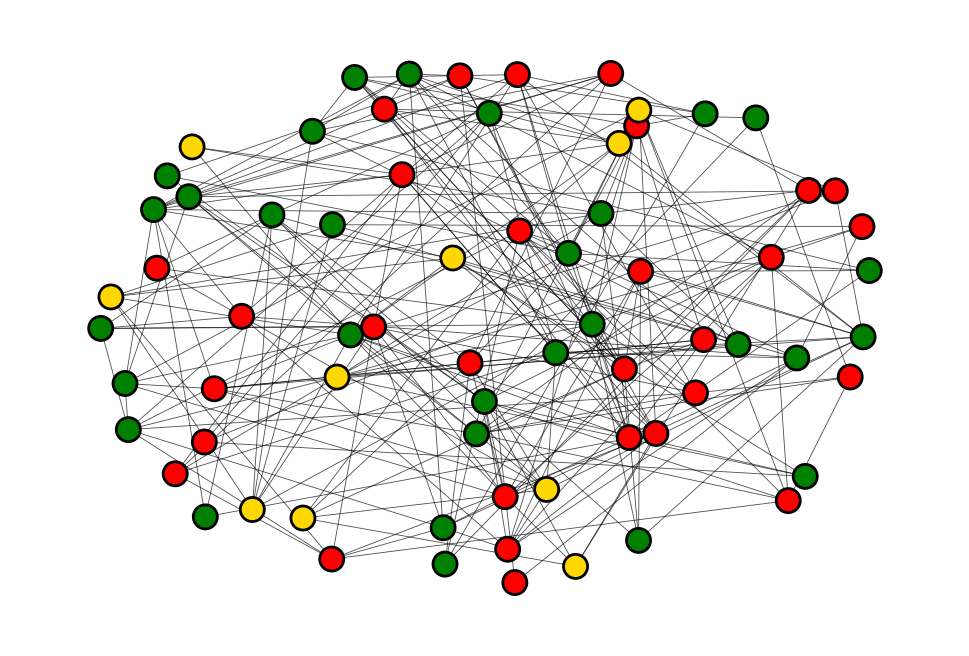
For example, in the plot below healthy nodes are green, infected nodes are red and recovered nodes are yellow.
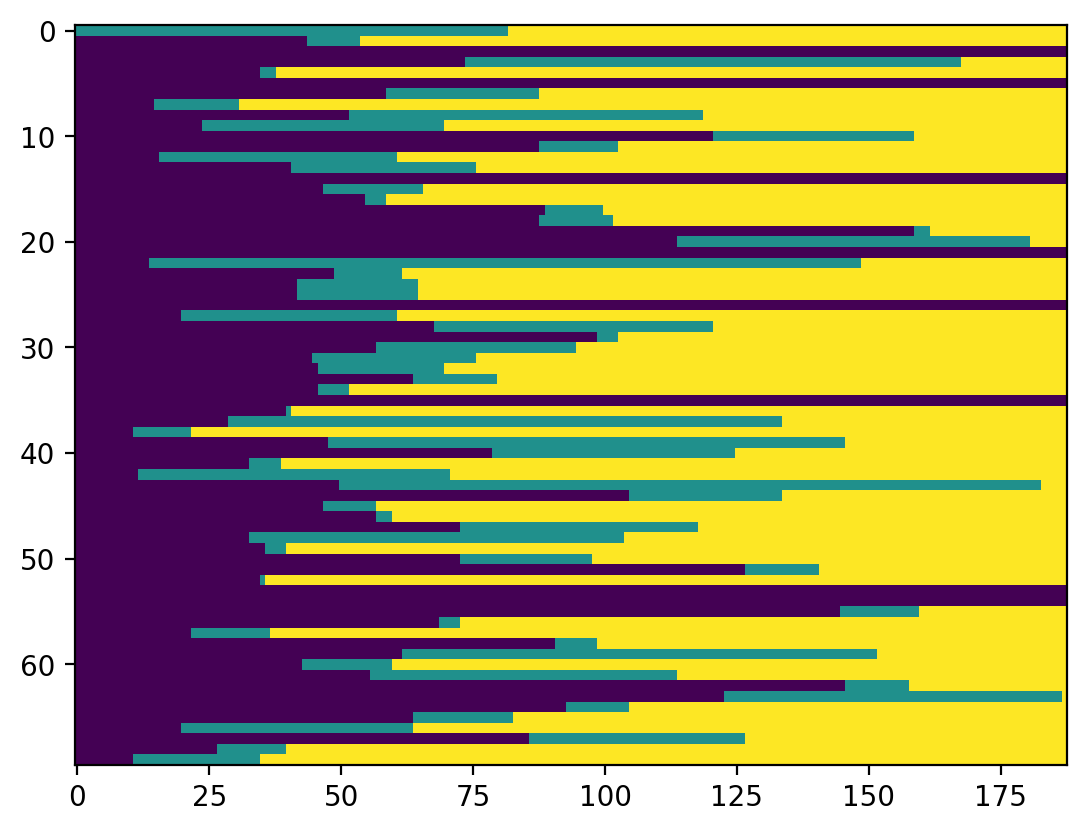
To model the spread of an epidemic we choose two numbers pi, pr . Then the epidemic is modeled step by step as follows:
We start with some number of infected nodes, all other nodes healthy.
At each step, an infected node infects each of its healthy neighbors with probability
pi. Also, an infected node recovers from the infection with probabilitypr.
Project
Use the epidemic model to investigate various aspects of epidemic spead. Here are some possible topics you may consider. You do not need to investigate all of them - you can choose a few or come up with different topics on you own.
How does the progression of the epidemic depend on properties of the graph (size, average degree, etc.).
Fix the probability of recovery
prand vary the probability of infectionpi. How does the fraction of nodes that will eventually get infected changes aspiincreases? How does the maximum number of nodes who are infected at once during the course of the epidemic depends onpi?Repeat part 2, but keeping
piand changing values ofpr.Introduce another state of nodes
3(vaccinated). A node in this state cannot get infected. Assume that some fraction of nodes are in this state at the beginning. How does this affect the epidemic spread? How does it depend on the size of the fraction of vaccinated nodes?Lets say that we have only a limited number of vaccines that we can use. Does it matter if we vaccinate random nodes, or if we select some specific nodes (e.g. ones with the biggest degrees)?
Effect of social distancing: assume that we remove some fraction of edges from the graph. How will it affect the spread of the epidemic?
Change the model, so that a recovered mode can get infected again. Fix the value of
prand varypi. For what values ofpiepidemic dies off after some time and for what values it seems to persist indefinitely?